
Archivo:XYZ-DIS magnetic field coordinates.svg

Tamaño de esta previsualización PNG del archivo SVG: 512 × 175 píxeles. Otras resoluciones: 320 × 109 píxeles · 640 × 219 píxeles · 1024 × 350 píxeles · 1280 × 438 píxeles · 2560 × 875 píxeles.
Ver la imagen en su resolución original ((Imagen SVG, nominalmente 512 × 175 pixels, tamaño de archivo: 8 kB))
Resumen
| Descripción |
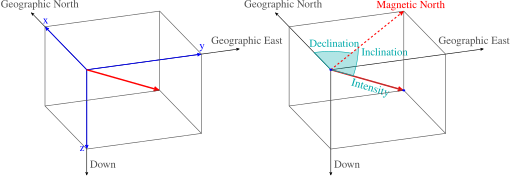
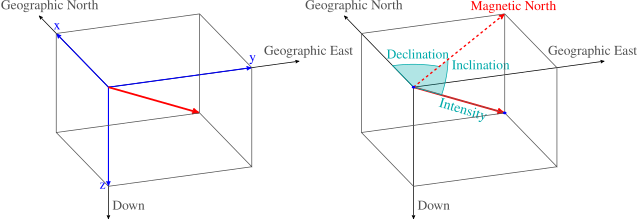
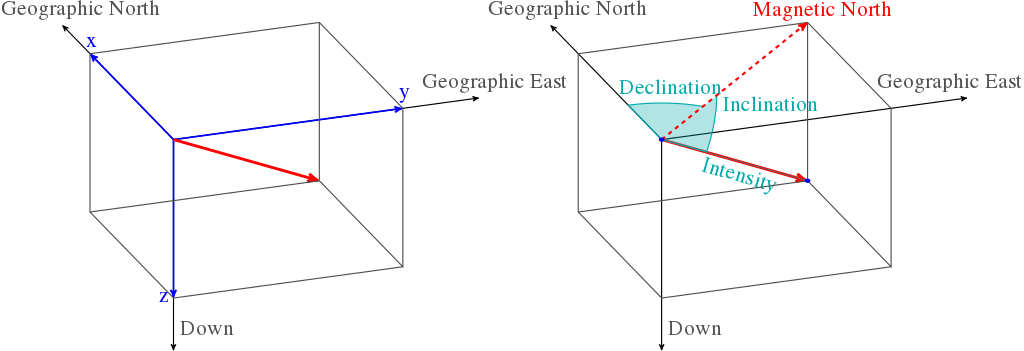
English: The graphic serves to represent the analogy of the XYZ and the more commonly used DIS coordinate systems. Blue indicated the coordinates in the two different systems, while red indicates the resultant magnetic field. |
| Fecha | |
| Fuente |
Trabajo propio |
| Autor |
Chymæra Recreated in LaTeX by: Rubber Duck (☮ • ✍) |
| SVG desarrollo | El código fuente de esta imagen SVG es válido. Este gráfico vectorial fue creado con LaTeX por Rubber Duck (☮ • ✍) and converted to SVG using dvisvgm and manually edited. |
| Código fuente | SVG code\documentclass[12pt,border=0pt,tikz,class=scrartcl,multi=false]{standalone}
\usepackage{times}
\usepackage{pgfplots}
\pgfplotsset{compat=1.10}
\usetikzlibrary{arrows,decorations.text}
\usepackage{tikz-3dplot}
\pagestyle{empty}
\begin{document}
\def\LA{2}
\def\Lb{1.5}
\def\gap{1.5cm}
\tdplotsetmaincoords {-60}{70}
\begin{tikzpicture}[thick,auto,>=stealth',xscale=4,yscale=3,tdplot_main_coords]
\begin{scope} [xshift=-\gap]
\draw [->] (0,0,0) -- (-\LA,0,0) node [anchor=south,gray] {Geographic North};
\draw [->] (0,0,0) -- (0,\LA,0) node [anchor=south,gray] {Geographic East};
\draw [->] (0,0,0) -- (0,0,\LA) node [pos=.9,right,gray] {Down};
\draw [->,blue,very thick] (0,0,0) -- (-\Lb,0,0) node [anchor=south] {x};
\draw [->,blue,very thick] (0,0,0) -- (0,\Lb,0) node [anchor=south] {y};
\draw [->,blue,very thick] (0,0,0) -- (0,0,\Lb) node [left] {z};
\draw [->,red,line width=2pt] (0,0,0) -- (-\Lb,\Lb,\Lb);
\draw [gray] (-\Lb,0,0) -- ++(0,\Lb,0) -- ++(\Lb,0,0)
-- ++(0,0,\Lb) -- ++(-\Lb,0,0) -- ++(0,0,-\Lb)
(-\Lb,0,0) -- ++(0,0,\Lb) -- ++(\Lb,0,0) -- ++(0,\Lb,0)
(-\Lb,0,\Lb) -- ++(0,\Lb,0)
;
\end{scope}
\begin{scope} [xshift=\gap]
\draw [->] (0,0,0) -- (-\LA,0,0) node [anchor=south,gray] {Geographic North};
\draw [->] (0,0,0) -- (0,\LA,0) node [anchor=south,gray] {Geographic East};
\draw [->] (0,0,0) -- (0,0,\LA) node [pos=.9,right,gray] {Down};
\draw [->,red,line width=2pt] (0,0,0) -- (-\Lb,\Lb,\Lb);
\draw [thin,cyan,postaction={decoration={text along path,
raise=-10pt,text color=cyan,text align={center},
text={Intensity} },decorate}]
(0,0,0) -- (-\Lb,\Lb,\Lb);
\tdplotsetthetaplanecoords{135};
%\tdplotdrawarc [tdplot_rotated_coords,cyan] {(0,0,0)} {.8} {55}{90}{above right=5pt and 0pt}{Inclination};
\draw [tdplot_rotated_coords,fill=cyan,fill opacity=.3,cyan] (0,.8,0)
arc (90:55:.8) node [pos=.1,right,opacity=1] {Inclination}
-- (0,0,0);
%\tdplotdrawarc [cyan,fill=cyan] {(0,0,0)} {.6} {180}{135}{above}{Declination};
\draw [cyan,fill=cyan,fill opacity=.3] (0,0,0) -- (-.6,0,0)
arc (180:135:.6) node [above,pos=.5,opacity=1] {Declination};
\draw [gray] (-\Lb,0,0) -- ++(0,\Lb,0) -- ++(\Lb,0,0)
-- ++(0,0,\Lb) -- ++(-\Lb,0,0) -- ++(0,0,-\Lb)
(-\Lb,0,0) -- ++(0,0,\Lb) -- ++(\Lb,0,0) -- ++(0,\Lb,0)
(-\Lb,0,\Lb) -- ++(0,\Lb,0)
;
\draw [->,red,dashed, line width=1.5pt] (0,0,0) -- (-\Lb,\Lb,0) node [anchor=south] {Magnetic North};
\draw [fill=blue,draw=none] (0,0,0) circle (.5pt) (-\Lb,\Lb,\Lb) circle (.5pt);
\end{scope}
\end{tikzpicture}
\end{document}
|

|
Este archivo SVG contiene texto incrustado que puede traducirse a su lengua, mediante un editor que admita SVG (como XML o texto). Para más información, véase: Sobre la traducción de archivos SVG. |
Licencia
Yo, el titular de los derechos de autor de esta obra, la publico en los términos de la siguiente licencia:
Este archivo se encuentra bajo la licencia Creative Commons Genérica de Atribución/Compartir-Igual 3.0.
- Eres libre:
- de compartir – de copiar, distribuir y transmitir el trabajo
- de remezclar – de adaptar el trabajo
- Bajo las siguientes condiciones:
- atribución – Debes otorgar el crédito correspondiente, proporcionar un enlace a la licencia e indicar si realizaste algún cambio. Puedes hacerlo de cualquier manera razonable pero no de manera que sugiera que el licenciante te respalda a ti o al uso que hagas del trabajo.
- compartir igual – En caso de mezclar, transformar o modificar este trabajo, deberás distribuir el trabajo resultante bajo la misma licencia o una compatible como el original.
Historial del archivo
Haz clic sobre una fecha y hora para ver el archivo tal como apareció en ese momento.
| Fecha y hora | Miniatura | Dimensiones | Usuario | Comentario | |
|---|---|---|---|---|---|
| actual | 19:26 22 abr 2015 | 512 × 175 (8 kB) | Krishnavedala | increased font size and more optimized | |
| 19:17 22 abr 2015 | 892 × 306 (8 kB) | Krishnavedala | Better drawing with bigger and legible translatable fonts. | ||
| 02:17 8 jun 2012 |  | 644 × 266 (27 kB) | Chymæra | font issues | |
| 01:58 8 jun 2012 |  | 644 × 266 (29 kB) | Chymæra | {{subst:Upload marker added by en.wp UW}} {{Information |Description = {{en|The graphic serves to represent the analogy of the XYZ and the more commonly used DIS coordinate systems. Blue indicated the coordinates in the two different systems, while red... |
Usos del archivo
La siguiente página usa este archivo:
Uso global del archivo
Las wikis siguientes utilizan este archivo:
- Uso en ast.wikipedia.org
- Uso en bn.wikipedia.org
- Uso en ca.wikipedia.org
- Uso en en.wikipedia.org
- Uso en hi.wikipedia.org
- Uso en it.wikibooks.org
- Uso en it.wikiversity.org
- Uso en or.wikipedia.org
- Uso en pt.wikipedia.org
- Uso en tr.wikipedia.org
- Uso en vi.wikipedia.org