
Archivo:BAMS climate assess boulder water vapor 2002 - 2.png
No se dispone de una resolución más alta.
BAMS_climate_assess_boulder_water_vapor_2002_-_2.png (775 × 425 píxeles; tamaño de archivo: 12 kB; tipo MIME: image/png)
Resumen
| Descripción |
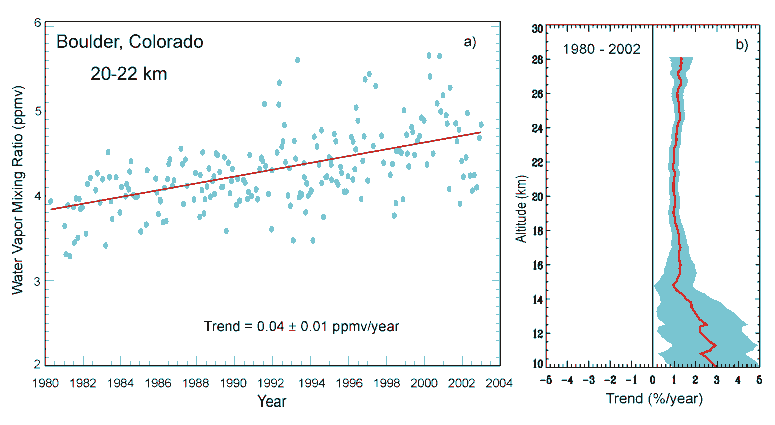
English: Stratospheric water vapor 1% increase. 30% may be due to increased methane.
|
||
| Fuente | http://www.cmdl.noaa.gov/hotitems/watervapor.html | ||
| Autor | NOAA |

Licencia
Esta imagen es de dominio público porque contiene material que vino originalmente de la Administración Nacional Oceánica y Atmosférica de los Estados Unidos de América, recibidas o hechas en el curso de las funciones oficiales de un empleado.
|
Registro original de carga
| Fecha y hora | Dimensiones | Usuario | Comentario |
|---|---|---|---|
| 5 de julio de 2006, 13:42:17 | 775 × 425 (13969 bytes) | Nils Simon (discusión · contribs.) | {{PD-USGov-DOC-NOAA}} |
Historial del archivo
Haz clic sobre una fecha y hora para ver el archivo tal como apareció en ese momento.
| Fecha y hora | Miniatura | Dimensiones | Usuario | Comentario | |
|---|---|---|---|---|---|
| actual | 12:21 21 ago 2014 | | 775 × 425 (12 kB) | GifTagger | Bot: Converting file to superior PNG file. (Source: BAMS_climate_assess_boulder_water_vapor_2002.gif). This GIF was problematic due to non-greyscale color table. |
Usos del archivo
La siguiente página usa este archivo:
Uso global del archivo
Las wikis siguientes utilizan este archivo:
- Uso en ca.wikipedia.org
- Uso en de.wikipedia.org
- Uso en en.wikipedia.org
- Uso en fa.wikipedia.org
- Uso en gu.wikipedia.org
- Uso en hi.wikipedia.org
- Uso en hr.wikipedia.org
- Uso en id.wikipedia.org
- Uso en nl.wikipedia.org
- Uso en nn.wikipedia.org
- Uso en pl.wikipedia.org
- Uso en sc.wikipedia.org
- Uso en sh.wikipedia.org
- Uso en sw.wikipedia.org
- Uso en ta.wikipedia.org
- Uso en zh.wikipedia.org