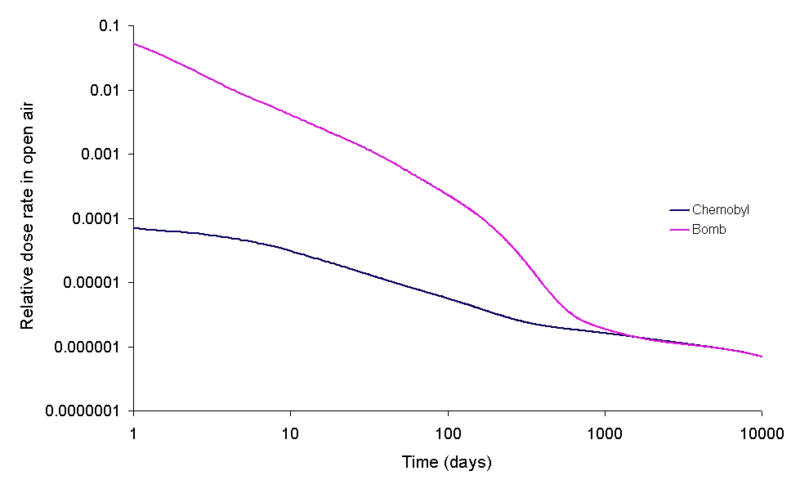
Archivo:Bombvschernobyldoserateinopenair.png

Contenido de la página no disponible en otros idiomas.
De Wikipedia, la enciclopedia libre

Ver la imagen en su resolución original(979 × 598 píxeles; tamaño de archivo: 4 kB; tipo MIME: image/png)

Resumen

This is a graph drawn using data calculated using a method similar to that of T. Imanaka, S. Fukutani, M. Yamamoto, A. Sakaguchi and M. Hoshi, J. Radiation Research, 2006, 47, Suppl A121-A127 for calculating the dose due to the bomb fall out which calculated for a surface burst with no separation of the different isotopes. 131I, 133I, 132Te, 133I, 135I, 140Ba, 95Zr, 97Zr, 99Mo, 99mTc, 103Ru, 105Ru, 106Ru, 142La, 143Ce, 137Cs, 91Y, 91Sr, 92Sr, 128Sb and 129Sb are the gamma emitters which have been conisdered for the bomb fallout. The fission was assumed to have been caused by 1 MeV neutrons and 20% occurred in the 238U tamper of the bomb, the dose does not include the effect of any shielding. The data was from the Korean table of the isotopes.

For the chernobyl fallout

The contributions made by the different isotopes to the dose (in air) caused in the contaminated area in the time shortly after the accident. Note that this image was drawn using data from the OECD report, the Korean table of the isotopes and the second edition of 'The radiochemical manual'.

Data on the release was taken from the following two sources. It was assumed that the whole release occurred on the first day in an instant.

A short report on the release of radioisotopes from the site is on the OSTI web site[1]. A more detailed report can be downloaded from the OECD web site's public library[2] as a 1.85MB PDF file.

  1. Chernobyl source term, atmospheric dispersion, and dose estimation, EnergyCitationsDatabase, November 1, 1989
  2. OECD Papers Volume 3 Issue 1[dead link], OECD, 2003
Descripción
English: See the graphs on the trinity glass in J. Environmental Radioactivity
Fecha
Fuente w:Image:Bombvschernobyldoserateinopenair.jpg
Autor wikipedia:en:user:Cadmium
Permiso
(Reutilización de este archivo)
Esta imagen ha sido (por este medio) publicada en el dominio público por su autor, Cadmium en el proyecto Wikimedia Commons. Esto se aplica mundialmente.

En caso de que no sea legalmente posible:
Cadmium garantiza a todos el derecho de usar este trabajo para cualquier propósito, sin ninguna condición, excepto que dichas condiciones sean requeridas por ley.

Otras versiones w:Image:Bombvschernobyldoserateinopenair.jpg

Leyendas

Añade una explicación corta acerca de lo que representa este archivo

Elementos representados en este archivo

representa a

f0a296849278f0e1ddc8f221a2f1a3bef275548d

598 píxel

979 píxel

Historial del archivo

Haz clic sobre una fecha y hora para ver el archivo tal como apareció en ese momento.

Fecha y horaMiniaturaDimensionesUsuarioComentario
actual17:05 26 oct 2006Miniatura de la versión del 17:05 26 oct 2006979 × 598 (4 kB)Helix84== Summary == This is a graph drawn using data calculated using a method similar to that of T. Imanaka, S. Fukutani, M. Yamamoto, A. Sakaguchi and M. Hoshi, ''J. Radiation Research'', 2006, '''47''', Suppl A121-A127 for calculating the dose due to the bom

La siguiente página usa este archivo:

Uso global del archivo

Las wikis siguientes utilizan este archivo: