
Archivo:Climatic zones and antipodes.png
Climatic_zones_and_antipodes.png (180 × 180 píxeles; tamaño de archivo: 31 kB; tipo MIME: image/png)
Resumen
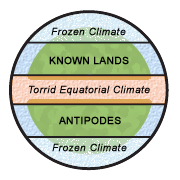
Diagram illustrating the classical climatic zones. The torrid (and "unhabitable") climatic zone of the equator is in red, the cold (and "unhabitable") climatic zones at the poles are in white/blue.
"Dating back to classical times, most people thought of the world as divided into zones of climate: a frozen climate at the poles, a torrid climate at the equator, and a blissfully mild (and therefore habitable) climate in between. They logically connected the temperature difference of these zones with proximity to the sun, and to a large extent they were right. Where they were wrong, however, was in their belief that the cold and torrid zones were impassable." [1] archive copy at the Wayback Machine
This image was made by Leinad-Z. Based on Image:Mappaemundi vertical.gif by John Hamer and inspired by images from Macrobius' Commentarii in Somnium Scipionis. More specifically, the picture is related with the two diagrams below.
-
 The five climatic zones of the earth.
 -
 Figure of the Earth from Macrobius.


Licencia
- Eres libre:
- de compartir – de copiar, distribuir y transmitir el trabajo
- de remezclar – de adaptar el trabajo
- Bajo las siguientes condiciones:
- atribución – Debes otorgar el crédito correspondiente, proporcionar un enlace a la licencia e indicar si realizaste algún cambio. Puedes hacerlo de cualquier manera razonable pero no de manera que sugiera que el licenciante te respalda a ti o al uso que hagas del trabajo.

|
Esta imagen debería volverse a crear como imágenes vectoriales SVG. Esto proporciona muchas ventajas, véase Commons:Media for cleanup (en inglés) para más información. Si ya hay una versión SVG de esta imagen disponible, por favor súbala a Commons. Tras subirla, reemplace esta plantilla con la plantilla
{{vector version available|nuevo nombre de imagen.svg}} en esta imagen. |
Historial del archivo
Haz clic sobre una fecha y hora para ver el archivo tal como apareció en ese momento.
| Fecha y hora | Miniatura | Dimensiones | Usuario | Comentario | |
|---|---|---|---|---|---|
| actual | 21:25 18 ago 2006 | | 180 × 180 (31 kB) | Leinad-Z~commonswiki | "Texturized" version. |
| 21:23 18 ago 2006 |  | 180 × 180 (12 kB) | Leinad-Z~commonswiki | New colors and text position. | |
| 19:44 17 ago 2006 |  | 180 × 180 (12 kB) | Leinad-Z~commonswiki | Made by by Leinad-Z. Based on Image:Mappaemundi vertical.gif by John Hamer. |
Usos del archivo
La siguiente página usa este archivo:
Uso global del archivo
Las wikis siguientes utilizan este archivo:
- Uso en ar.wikipedia.org
- Uso en en.wikipedia.org
- Uso en hu.wikipedia.org
- Uso en no.wikipedia.org