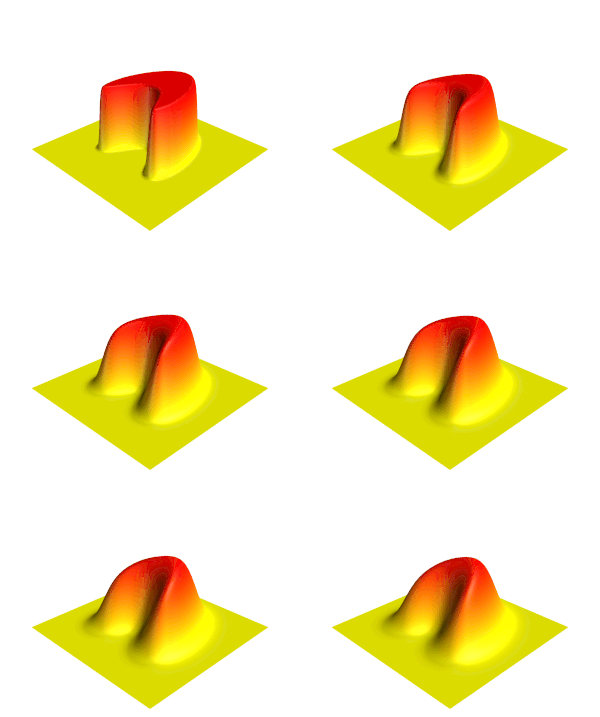
Archivo:Heat eqn.gif

Contenido de la página no disponible en otros idiomas.
De Wikipedia, la enciclopedia libre

Heat_eqn.gif(200 × 136 píxeles; tamaño de archivo: 500 kB; tipo MIME: image/gif, bucleado, 181 frames, 6,0s)

Resumen

Descripción
English: Illustration of the Heat equation.
Fecha (UTC)
Fuente Trabajo propio
 
Este diagrama fue creado con MATLAB.
Autor Oleg Alexandrov
Otras versiones

Licencia

Public domain Yo, el titular de los derechos de autor de esta obra, lo libero al dominio público. Esto aplica en todo el mundo.
En algunos países esto puede no ser legalmente factible; si ello ocurriese:
Concedo a cualquier persona el derecho de usar este trabajo para cualquier propósito, sin ningún tipo de condición al menos que éstas sean requeridas por la ley.

MATLAB source code

% illustration of the heat equation
% Solve the heat equation using finite differences and Forward Euler
function main()
 
   % the number of data points. More points means prettier picture.
   N = 400;
 
   L = 2.5; % the box size is [-L, L] x [-L, L]
 
   XX = linspace(-L, L, N);
   YY = linspace(-L, L, N);
   [X, Y] = meshgrid(XX, YY);
 
   scale = 2;
   Z = get_step_function (N, scale, X, Y);
 
   CFL = 0.125; % CourantFriedrichsLewy
   dx = XX(2)-XX(1);  dy = dx; % space grid
   dt = CFL*dx^2;
 
   plot_dt = 0.004; % plot every plot_dt iterations

   cmap = rv_matrix_rows(autumn); % colormap
   
   % Solve the heat equation with zero boundary conditions
   T = 0:dt:1;
   iter = 0;
   frame_no = 0;
   for t=T
 
      % plot the current temperature distribution
      if floor(t/plot_dt) + 1 > frame_no
 
         frame_no = frame_no + 1
 
        % plot the surface
         figure(2); clf; 
         surf(X, Y, Z);
 
         %  make the surface beautiful
         shading interp; colormap(cmap); 
 
         % add in a source of light
         camlight (-50, 54);
         lighting phong;
 
         % viewing angle
         view(-40, 38);
 
         axis equal; axis off;
         axis([-L, L, -L, L, 0, scale])
 
         hold on; plot3(0, 0, 3.4, 'g*'); % a marker to help with cropping
 
         pause(0.1);
         %return
 
         file = sprintf('Movie_frame%d.png', 1000+frame_no);
         %saveas(gcf, file) %save the current frame
         print(gcf, '-dpng', '-r400', file) %save the current frame
 
         disp(file); %show the frame number we are at
 
         % cut at max_fr_no frames
         max_fr_no = 15; 
         if frame_no >= max_fr_no
            break
         end
 
      end
 
      % advance in time
      W = 0*Z;
      for i=2:(N-1)
         for j=2:(N-1)
 
            W(i, j) = Z(i, j) + dt * ( Z(i+1, j) + Z(i-1, j) + Z(i, j-1) + Z(i, j+1) - 4*Z(i, j))/dx^2;
 
         end
      end
      Z = W;
 
   end
 
 
% The gif image was creating with the command 
% convert -antialias -loop 10000  -delay 20 -compress LZW Movie_frame10* Heat_eqn.gif 
 
% get a function which is 1 on a set, and 0 outside of it
function Z = get_step_function(N, scale, X, Y)
 
   c = 2;
   d=-1;
   e=1;
   f=0.5;
   k=1.2;
   shift=10;
 
   Z = (c^2-(X/e-d).^2-(Y/f).^2).^2 + k*(c+d-X/e).^3-shift;
 
   Z = 1-max(sign(Z), 0);
   Z = scale*Z;

function X = rv_matrix_rows(X)

   [m, n] = size(XL);

   for i = 1:m
      j = m + 1 - i;
      if i < j
         tmp = X(i, :); X(i, :) = X(j, :); X(j, :) = tmp;
      end
   end

Leyendas

Animación de la ecuación del calor.

Elementos representados en este archivo

representa a

Historial del archivo

Haz clic sobre una fecha y hora para ver el archivo tal como apareció en ese momento.

Fecha y horaMiniaturaDimensionesUsuarioComentario
actual18:01 2 feb 2024Miniatura de la versión del 18:01 2 feb 2024200 × 136 (500 kB)Jahobrmore frames (by user Emil Dalalyan)
01:25 12 abr 2019Miniatura de la versión del 01:25 12 abr 2019200 × 136 (172 kB)Jorge StolfiDuplicated some framed at beginning so that readers can see the initial state. Added a couple blank frames at end to make it clear that the simulation ended. Slowed down the movie a bit.
19:58 24 abr 2011Miniatura de la versión del 19:58 24 abr 2011200 × 136 (116 kB)Oleg AlexandrovReverse the colormap (red is high).
06:11 23 nov 2007Miniatura de la versión del 06:11 23 nov 2007199 × 140 (126 kB)Oleg AlexandrovTweak, same license
05:51 23 nov 2007Miniatura de la versión del 05:51 23 nov 2007200 × 129 (112 kB)Oleg Alexandrov{{Information |Description=Illustration of the en:Heat equation |Source=self-made with Matlab |Date=~~~~~ |Author= Oleg Alexandrov |Permission=PD-self, see below |other_versions= }} {{PD-self}} ==MATLAB source code== <pre>

Uso global del archivo

Las wikis siguientes utilizan este archivo: