
Archivo:Simpson's paradox continuous.svg

Tamaño de esta previsualización PNG del archivo SVG: 390 × 260 píxeles. Otras resoluciones: 320 × 213 píxeles · 640 × 427 píxeles · 1024 × 683 píxeles · 1280 × 853 píxeles · 2560 × 1707 píxeles.
Ver la imagen en su resolución original ((Imagen SVG, nominalmente 390 × 260 pixels, tamaño de archivo: 18 kB))
W3C-validity not checked.
Resumen
| Descripción |
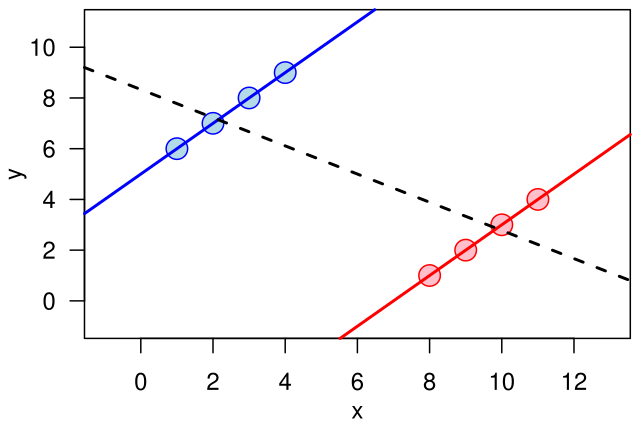
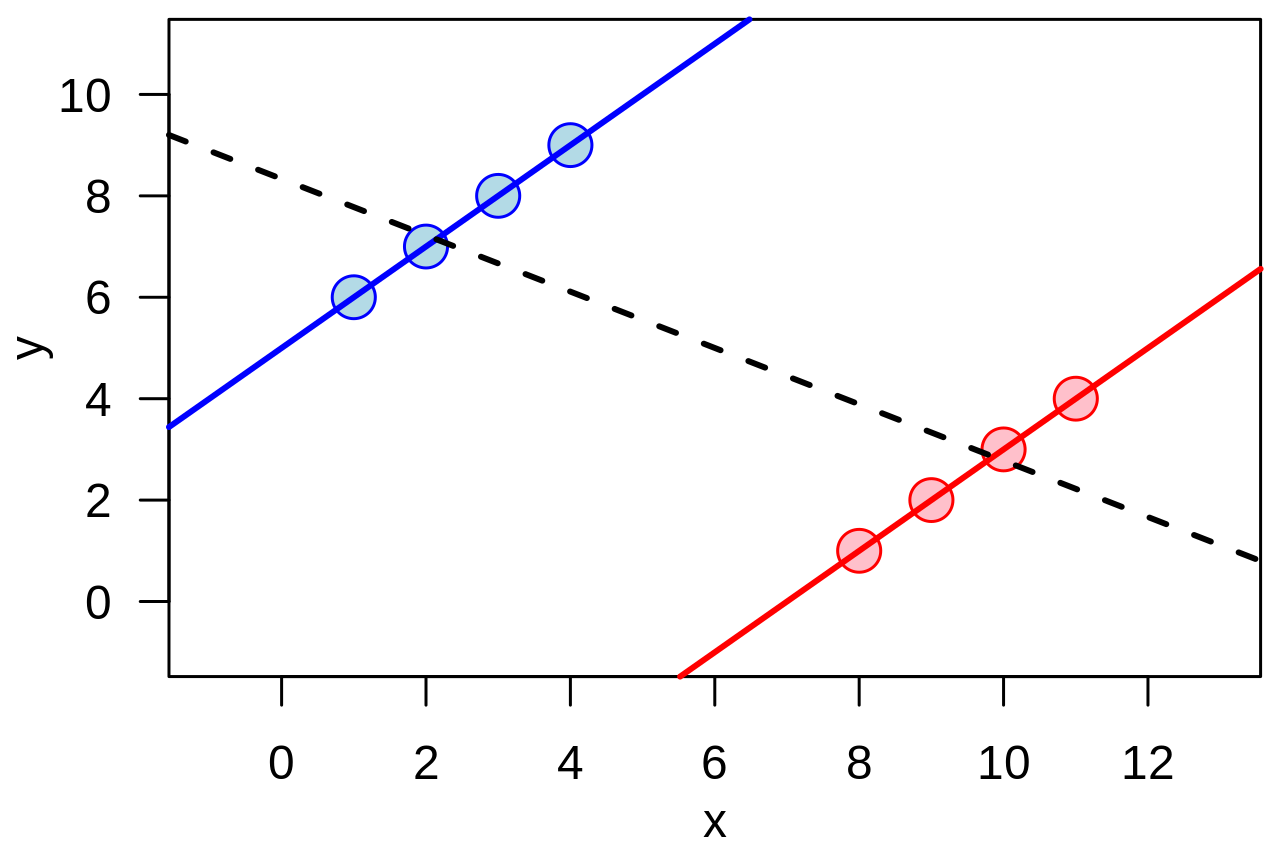
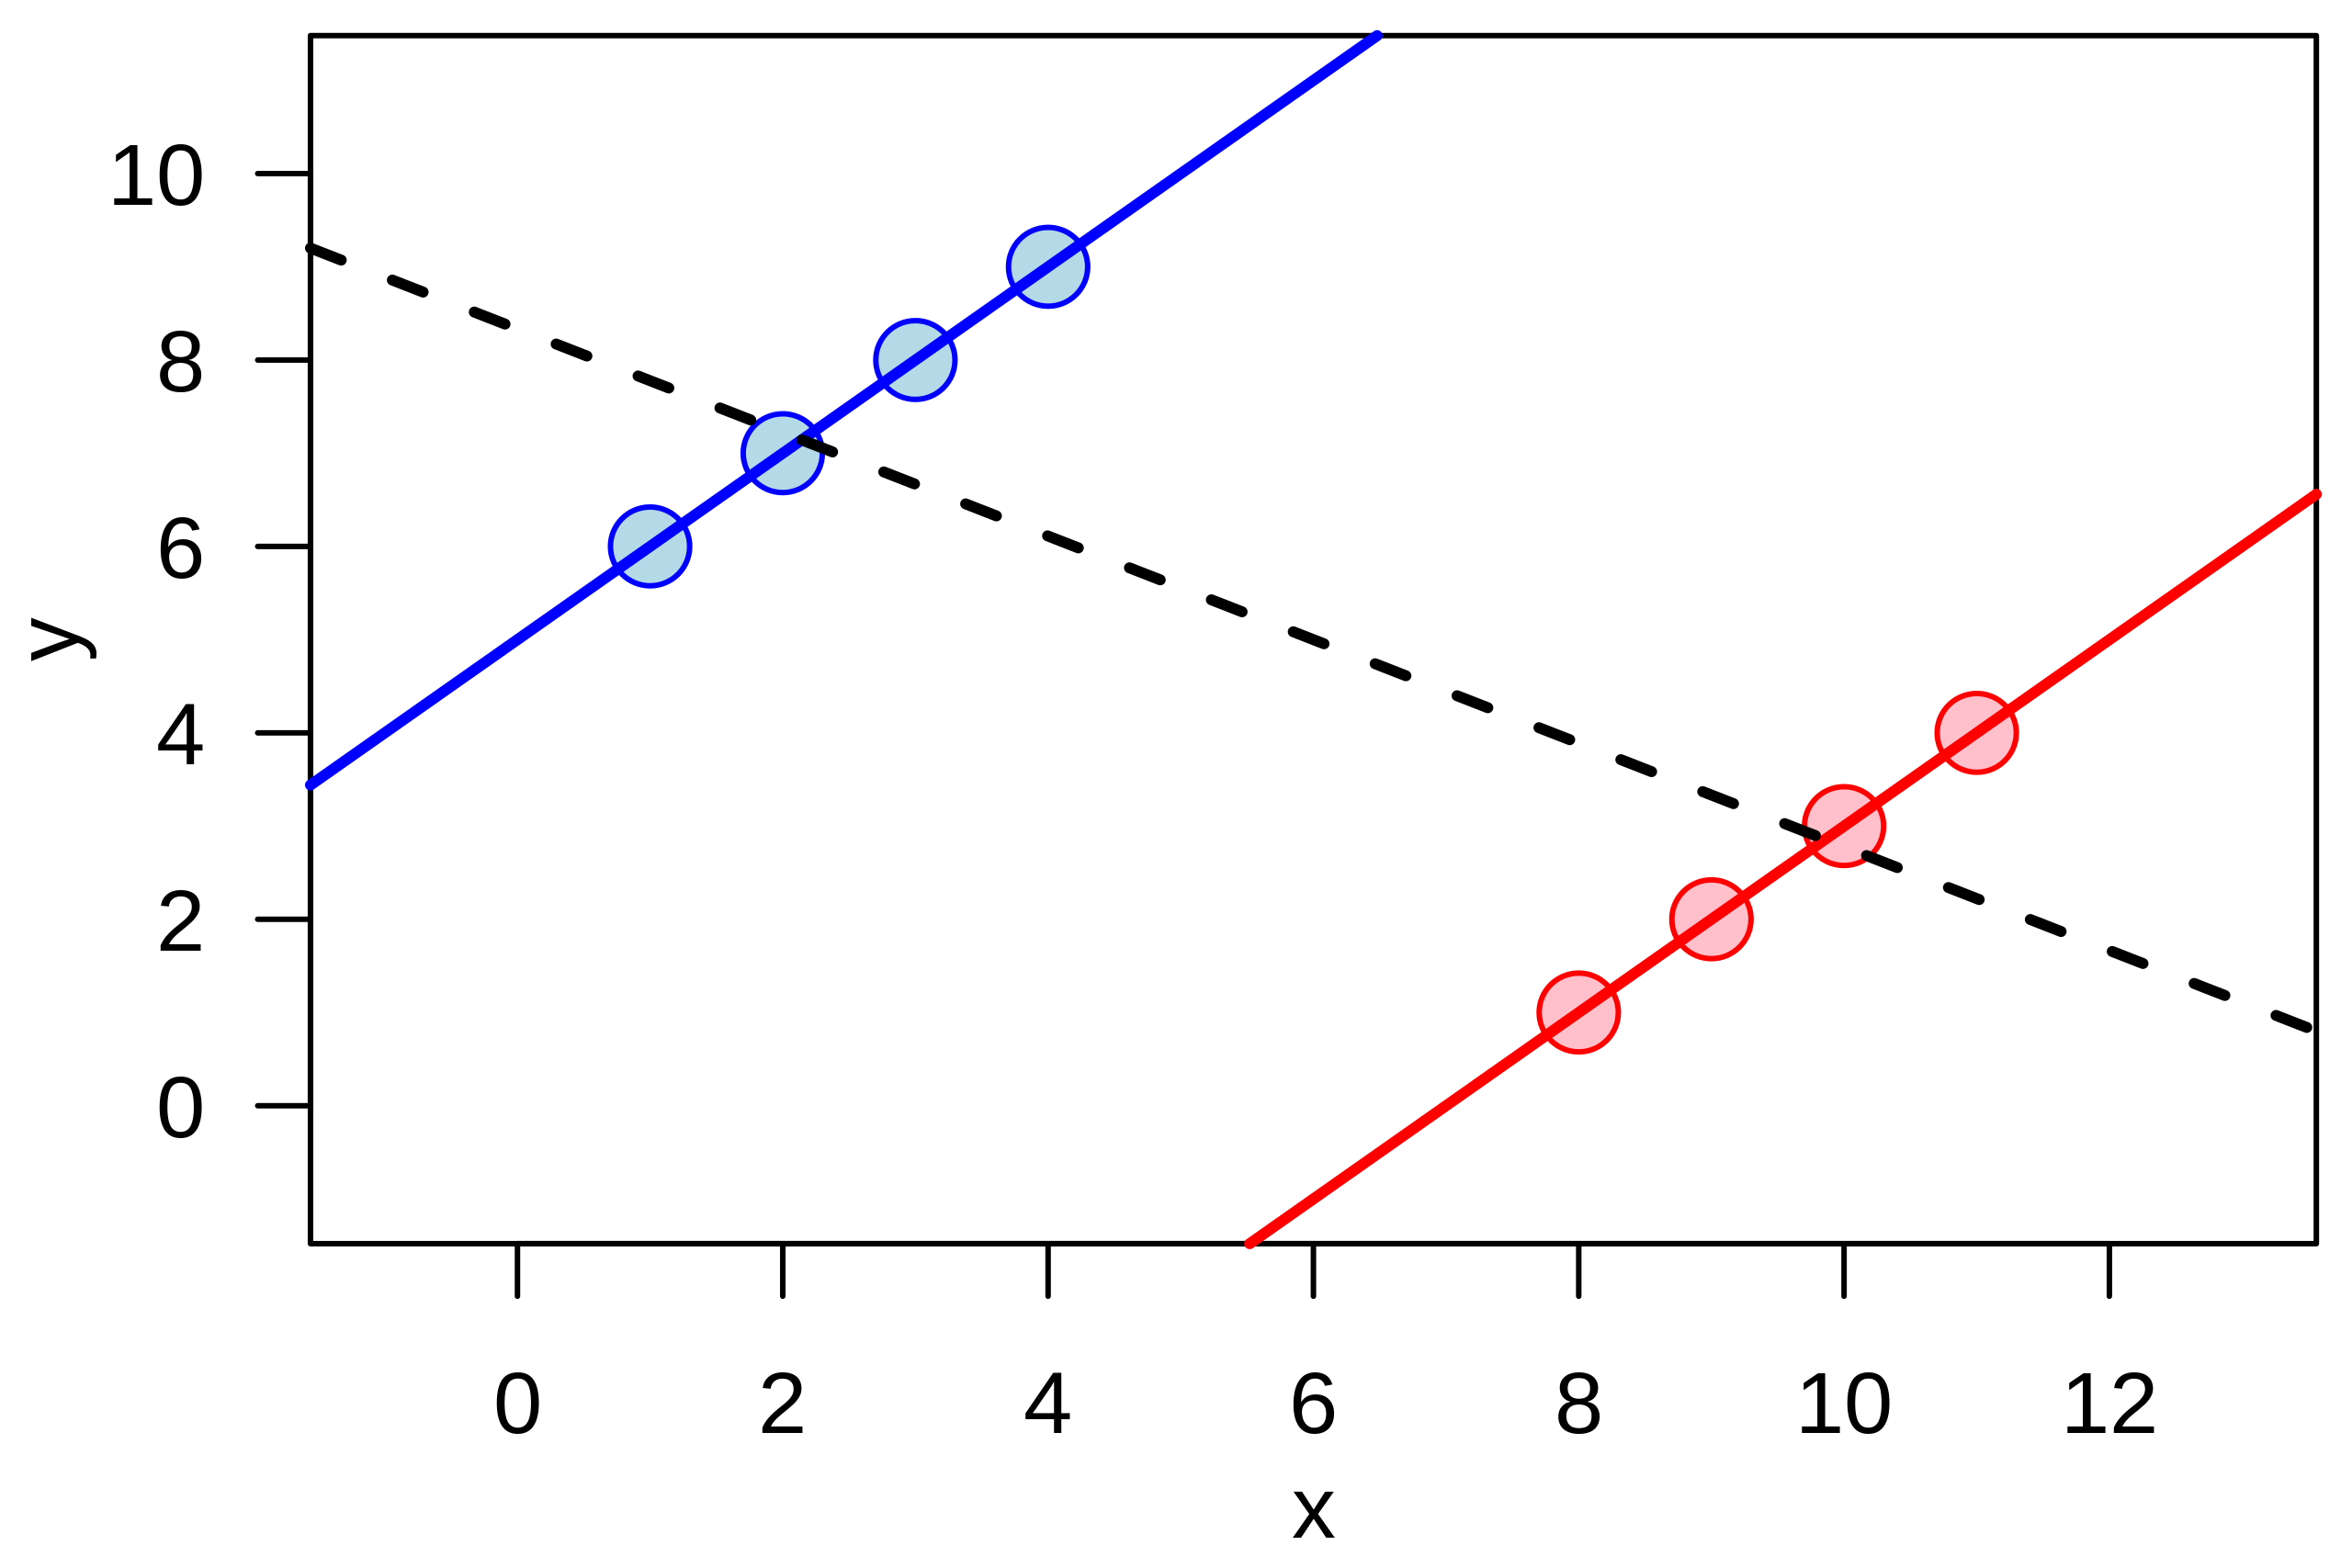
English: Illustration of the quantitative version of en:Simpson's paradox: a positive trend appears for two separate groups (blue and red), whereas a negative trend (black, dashed) appears when the groups are combined. |
| Fecha | |
| Fuente | Trabajo propio |
| Autor | Schutz |
Example of the quantitative version of w:Simpson's paradox.
The graphic was created by User:Schutz for Wikipedia on 14 June 2007, using the R statistical project. The program that generated and exported the graphic is given below; the uploaded version was generated slightly differently to workaround a bug during the PS to SVG conversion with pstoedit command. The layout was slightly modified using Inkscape before upload.
  x1 <- c(1,2,3,4)
  y1 <- x1 + 5

  x2 <- x1 + 7
  y2 <- x2 - 7

  x <- c(x1,x2)
  y <- c(y1,y2)

  postscript("simpson.eps", paper="special", width=4.5, height=3)

  par(las=1)
  par(mar=c(3,3,0.5,0.5))
  par(mgp=c(2,1,0))

  plot(x,y, cex=2, pch=21,
       col=rep(c("blue", "red"), each=4), bg=rep(c("lightblue", "pink"), each=4),
       xlim=range(x)+c(-2,2), ylim=range(y)+c(-2,2))
  abline(lm(y1 ~ x1), col="blue", lwd=2)
  abline(lm(y2 ~ x2), col="red", lwd=2)
  abline(lm(y  ~ x), lwd=2, lty=2)

  dev.off()
Licencia
| Este trabajo ha sido liberado al dominio público por su autor, I, Schutz. Esto aplica para todo el mundo. En algunos países esto puede no ser legalmente factible; si ello ocurriese: I, Schutz otorga a cualquier persona el derecho de usar este trabajo para cualquier propósito, sin ningún tipo de condición, a menos que éstas sean requeridas por la ley. |
Historial del archivo
Haz clic sobre una fecha y hora para ver el archivo tal como apareció en ese momento.
| Fecha y hora | Miniatura | Dimensiones | Usuario | Comentario | |
|---|---|---|---|---|---|
| actual | 23:15 13 jun 2007 | | 390 × 260 (18 kB) | Schutz | {{Information |Description=Illustration of the continuous version of Simpson's paradox |Source=self-made |Date=14 June 2007 |Author=Schutz }} Example of the continuous version of w:Simpson's paradox. The graphic was created by [[User |
Usos del archivo
La siguiente página usa este archivo:
Uso global del archivo
Las wikis siguientes utilizan este archivo:
- Uso en ar.wikipedia.org
- Uso en ca.wikipedia.org
- Uso en cs.wikipedia.org
- Uso en cy.wikipedia.org
- Uso en de.wikipedia.org
- Uso en en.wikipedia.org
- Uso en eu.wikipedia.org
- Uso en fi.wikipedia.org
- Uso en fr.wikipedia.org
- Uso en he.wikipedia.org
- Uso en ko.wikipedia.org
- Uso en nl.wikipedia.org
- Uso en no.wikipedia.org
- Uso en pl.wikipedia.org
- Uso en pt.wikipedia.org
- Uso en ru.wikipedia.org
- Uso en sk.wikipedia.org
- Uso en ta.wikipedia.org
- Uso en uk.wikipedia.org
- Uso en vi.wikipedia.org
- Uso en www.wikidata.org
- Uso en zh.wikipedia.org